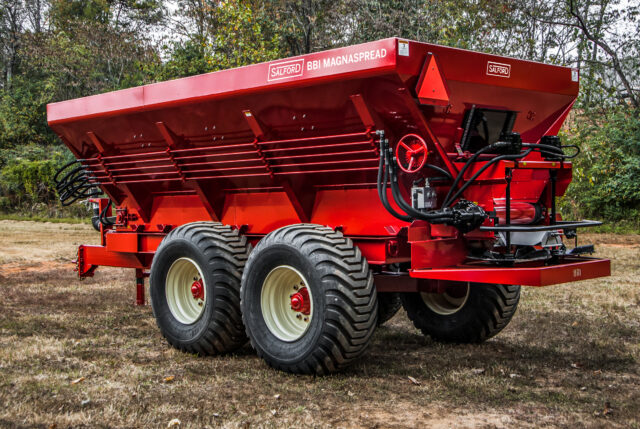
Cost-In-Use Calculator - Salford Group Inc.

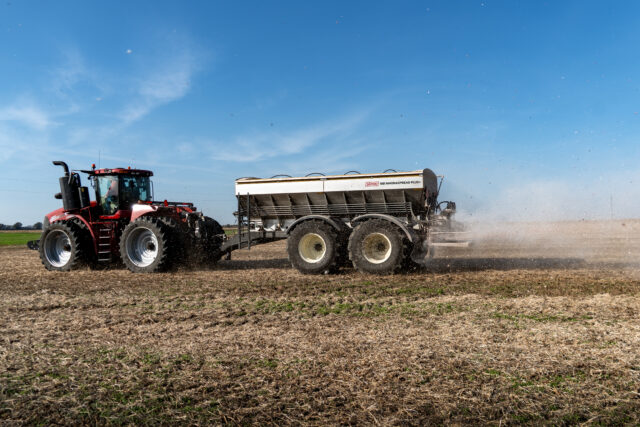
The Cost-in-Use Calculator is an interactive tool designed to show the real world operating costs and efficiency of a Salford applicator. It helps growers and operators compare Salford performance against either another owned spreader or a custom applicator service, using practical field inputs instead of list price or assumptions.

The focus is on fuel use, time efficiency, and total cost over the life of the machine, giving a realistic view of long-term value and return on investment (ROI).

Shared Operating Parameters
Current diesel pump price
Total acres per application
Fertilizer & lime passes
Spreader Specifications
Model pre-filled fields
Salford Spreader
Default: 10–12 mph
Default: varies by model
 
Effective swath width used
Other Spreader


* Maximum swath width varies by machinery options, application material type and quality, as well as environmental conditions.

Performance & Fuel Savings Results
Salford Spreader
Acres / Hour
Hrs / Application
Fuel Cost / Application
Annual Fuel Cost
Other Spreader
Acres / Hour
Hrs / Application
Fuel Cost / Application
Annual Fuel Cost
Lifetime Advantage — Salford Spreader
Total Fuel Savings
Over life of spreader
Hours Saved
Life of spreader
Fuel Cost Reduction
Per application vs. other
Relative annual fuel cost — Salford Spreader vs. Other
<< SalfordOther >>

* Values used in this example are representative of average numbers and are not intended to be specific to all applications.

Salford Spreader — Operating Inputs
Model pre-filled fields
THIRD-PARTY APPLICATION
Hired custom applicator rate
Year One Fertilizer Savings (Precision Spreading)
Material savings from precision application
FINANCIAL COMPARISON OF APPLICATION STRATEGIES
Salford Spreader Annual Cost
Hours / Application
Fuel / Application
Labor / Application
Annual Fuel + Labor
ANNUAL CONTRACT APPLICATION COST
Annual Application Fee
Acres × fee × applications/year
Year Breakeven
Investment Payback Period
Estimated time to recover investment when comparing in-house application to contracted services, including first-year efficiency gains.
Lifetime Returns
Year One Net Cash
Incl. purchase + fert. savings
Lifetime Savings (excl. fert.)
Lifetime Savings (incl. fert.)
YEAR-BY-YEAR NET COST DIFFERENCE
Year Annual Savings($) Cumulative Net Impact ($) Status

* Values are representative examples. Actual results will vary based on field conditions, equipment configuration, fuel prices, and individual operation.

Salford Group Inc.
Privacy Overview

This website uses cookies so that we can provide you with the best user experience possible. Cookie information is stored in your browser and performs functions such as recognising you when you return to our website and helping our team to understand which sections of the website you find most interesting and useful.